master-the-markets

Master The Markets And Make More Money

master-the-markets

We talk about financial markets a lot; but exactly what do we mean by “markets?” If you’re new to trading, you may immediately think “NASDAQ;” but the NASDAQ is only one of several exchanges on the U.S. stock market; and the U.S. stock market is only one of many markets available to traders. Bond, foreign exchange, derivatives and cryptocurrency are just a few examples of markets that offer buyers and sellers promising opportunities to make money.


There is no one-size-fits-all approach when it comes to choosing a market; so be sure to do your research before adopting any new trading strategies.


Here are some tips to help you understand some of the most popular financial markets and what makes them tick.

 What are financial markets?

Like any marketplace where goods are exchanged, financial markets make it possible for buyers and sellers to trade financial assets.

Take a moment and imagine your local farmer’s market. There are buyers, sellers and brokers. A buyer goes to a market in search of goods to purchase; while the seller attends a market in hopes of selling their goods to prospective buyers. In some cases, a seller may employ a broker who sells goods on their behalf for a commission. In the same way, a buyer may pay a broker to purchase goods on their behalf.

Each farmer’s market has certain rules participants must follow in order to ensure a fair and honest exchange of goods. For example, a seller may be required to prove ownership of the products they sell. Buyers may have to adhere to lines and pay taxes.

Finally, competition exists at any popular farmer’s market due to the vast variety of options available. Sellers will price their products based on supply and demand; and in some cases, buyers can negotiate lower rates.

Similar to your local farmer’s market, financial markets offer a space where institutional investors, retail investors and brokers connect to exchange securities and cold, hard cash. To trade successfully, financial market participants must adhere to rules that govern each market

and understand clearly how price works in order to negotiate the best rates and achieve profitability.

Financial market participants

Though not an exhaustive list, here are a few examples of the key players found in financial markets:

 Retail investors

Assuming you aren’t a financial advisor, retail investors are individuals, like you, who bring money to market to purchase and sell securities. Depending on the market, retail investors may trade securities through a brokerage that acts as an intermediary for each exchange.

Retail investors are often motivated to build personal wealth and enter the market with less purchasing power than institutions. While the activity of any one retail investor is not enough to shift the market direction, the collective demand of retail traders can build momentum behind existing trends.

 Institutional investors

An institutional investor is any company or organization that raises capital from clients or members to purchase and sell securities on their behalf. Examples of institutions include commercial banks, credit unions, insurance companies, pensions, hedge funds, real estate investment trusts (REIT), investment advisors, endowments and mutual funds.

Also known as “asset managers,” the world’s largest institutional investors manage billions of dollars. As a result, their buying power dwarfs that of individual retail investors. The sheer size of their positions can move prices substantially, creating huge waves that ripple throughout the market. Savvy traders follow the activity of institutional investors to predict trend reversals on both long and short sides.

Due to their size, institutional investors also act as a gateway into the stock market for public companies. Upon an initial public offering (IPO), companies will sell their shares to institutional investors first, who then release those shares slowly into the market for acquisition by eager retail investors.

 Brokers

Brokers act as an agent, connecting buyers with sellers, executing transactions, and earning commissions on each trade. You may recognize these commissions as exchange fees, although many brokers in the stock market have recently moved to commission-free models, thanks to the advent of Robinhood.

In exchange for commission, brokers provide valuable services to traders, including a platform where trades are executed, charting and analytics tools and investment consultants.

Financial markets and rules that govern them

While financial markets share a common purpose, no two markets are created the same. Markets diverge in the types of securities exchanged, how transactions occur, and the rules that govern them.

While this is not a comprehensive list of all markets, we’ve done our best to summarize some of the most talked-about exchanges and how they work.

 Stock market

Stock market investors exchange equity securities, also called “stocks” or “shares,” offered by publicly traded companies. The stock market is actually a network of exchanges including the NASDAQ, American Stock Exchange (AMEX), and New York Stock Exchange (NYSE). The term “stock exchange,” is also commonly used to refer to any one of these exchanges.

Each exchange represents a collection of indices, including the S&P 500 and Dow Jones Industrial Average (DJIA) index. These indices, in turn, track the supply and demand of 11 different market sectors including energy, financial and healthcare, to name a few. From here, we can further break down market sectors into industries. Much like the farmer’s market example above, there are more than 100 industries represented in the stock market including apparel retail, consumer electronics, entertainment, gold, silver and oil & gas.

Finally, there are about 2,800 individual public companies on the stock market that can be categorized by industry. For example, the technology industry represents a cluster of technology companies including Google, Microsoft, Apple and Tesla.

How it works

Stock prices are determined by supply and demand, and each share represents a percentage of ownership in a public company. Whenever you purchase or sell a stock, there’s a buyer or seller on the other end who’s willing to make a trade at your asking price. In the past, buyers and sellers bid for securities on a public floor. Today, exchanges happen primarily online with complex computer algorithms negotiating prices on behalf of buyers and sellers.

The stock market is open to anyone who has access to a broker. It is also possible to trade stock market indices indirectly through futures markets and exchange traded funds (ETFs).

 Bond market

If the stock market offers equity securities (shares of ownership in a company), the bond market offers debt securities (shares of debt in a company). The bond market is made up of several different markets, including the mortgage-backed bond market, corporate bond market and emerging bond market, and can further be tracked by indices including the Barclays Capital

Aggregate Bond Index, Merrill Lynch Domestic Master, and Citigroup Broad Investment Grade Index.

How it works

In the bond market, investors purchase debt securities brought by government entities and publicly traded corporations that want to pay down debts. New bonds are issued on the primary market, and once acquired, are traded on a secondary market. Unlike stock prices that are determined by supply and demand, the value of bonds fluctuate based on market growth and inflation. Investors will pay a fixed payment over a fixed amount of time, earning profit on interest once the bond has matured. Bond market indices can also be traded indirectly through mutual funds and bond exchange-traded funds.

The bond market is considered an over-the-counter (OTC) market, meaning bonds are not sold in a centralized place. For the most part, bonds are still traded over the phone, although

web-based bond trading is on the horizon. Bonds are primarily traded by institutional investors. Retail investors can also participate in bond trading through asset-managed bond funds.

 Foreign exchange market (forex)

If you’ve ever traveled and purchased a product abroad, you’ve likely made a forex transaction. The foreign exchange allows you to sell one type of national currency while simultaneously purchasing another. For example, if you travel from Europe to Japan, you will exchange the value of European Euros for the same value of Japanese Yen as determined by a set exchange rate, allowing you to make purchases with locally acceptable currency. The value comparison between two currencies is known as a “currency pair.”

How it works

The foreign exchange is an over-the-counter market, meaning there is no centralized regulatory body; rather, the exchange is run by a global network of banks and organizations. Currency valuations fluctuate based on global events and interest rates. Unlike the stock market which operates during set hours, the foreign exchange operates around the clock for nearly six days each week.

 Cryptocurrency Market (crypto)

With the dawn of Bitcoin in 2009, the exchange of digitally encrypted assets is a relatively new phenomena. There is no centralized body to issue or back cryptocurrencies, making them highly volatile and vulnerable to hackers. Due to low regulatory barriers, there are more than 200 exchanges available to cryptocurrency traders.

How it works

There are no brokers in cryptocurrency, exchanges happen primarily peer-to-peer. Investors bring real money to the cryptocurrency market and speculate on price movement based on supply and demand.

Derivatives Market

With an often estimated value of more than $1 quadrillion, the Derivatives Market is arguably one of the largest financial markets to exist. While that valuation is understandably debated, the very nature of derivative instruments make them undeniably ubiquitous across markets.

A derivative can be procured from virtually any financial asset, including the aforementioned stocks, stock indexes, bonds, currencies, commodities and more. The price of a derivative instrument is determined by the value of the underlying financial asset it is derived from. Simply put, as the value of a financial asset fluctuates, so does the price of the tethered derivative.

How it works

The derivatives market is made up of several markets including, but not limited to, options, futures, and contract for difference markets (CFD). Sometimes criticized for its similarity to gambling, a derivative trade is made by executing a contract between two or more parties who then ”bet” on how much the price of an asset will increase or decrease by a specified date.

Derivative trades are most commonly executed as options and futures contracts. Options contracts give buyers and sellers the flexibility of trading (or not trading) an asset at a predetermined price at any time during the duration of a contract; while futures contracts require a buyer and seller to execute a trade at a specific price, on a specific date. Derivatives are traded over the counter, with some of the most commonly traded derivatives including commodities and interest rates.

The bottom line

With so many opportunities to make money in financial markets, it’s hard to become bored with trading. There’s always something new to learn. Explore the complexities of various markets, and get to know how they work so you can be a better, more informed trader. Diversify your income streams with both long-term and short-term investments by exploring various markets; and check out our ebook All Traders Need Multiple Income Streams for more ways to build wealth.


Get out there and crush it!

For real-time insight follow me on Twitter! @Mv3Trader

Comment below with your opinions and questions.

recover-from-a-losing-streak

Bounce Back From Your Losing Streak And Keep Trading

recover-from-a-losing-streak

You’ve had a few bad trading days and now you’re ready to give up. You may have blown up your account one too many times and you’re thinking this isn’t for me. Before closing your accounts and unsubscribing from all your trading software, remember, no trader has become profitable by quitting. 


Whether it’s $50 or $5,000, losing money hurts; but that’s an inevitable part of this business. The best traders know how to brush themselves off, get back up and turn their losses into lessons. 


Here are some tips to help you change your mindset and recover from a losing streak. 

How to think: 

Every business goes through cycles where performance fluctuates between highs and lows and sometimes yields negative results. The business of trading is no different; and the more quickly you accept this, the better off you will be in the long run. 

Diversification creates peace of mind. 

By allowing yourself permission to have losing days and move forward from them, you relieve psychological stress that triggers bad habits, like overtrading, that can turn your worries into a self-fulfilling prophecy. This is easier said than done, especially if your entire portfolio is invested in the markets. That’s why the first thing to consider when bouncing back from a losing streak is diversification of your investments. 

By creating multiple streams of income, you can mentally give yourself space to make mistakes, and peace of mind knowing that you have a safety net. Check out our Ebook All Traders Need Multiple Income Streams of Income for more tips on how to build sustainable wealth. 

The market will always be there. 

Exchanges have been around since at least the 1300s and they aren’t going anywhere anytime soon. You can always trade, even if that means going back to the basics with a paper account. 

A losing streak isn’t the end of the world. Even the best traders have them. 

One of the best lessons any beginning trader can learn is how to lose gracefully. Be careful about comparing yourself to other traders. Seeing another trader rake in huge wins can be crushing to your confidence while you’re suffering loss after loss. Self-doubt may prevent you from taking smart risks that can help rebuild your account. 

A losing streak doesn’t make you a loser. 

Don’t take your losses personally. A few bad trading days doesn’t make you a bad trader. You may simply need to get back to the basics and revisit your trading strategy. Take some time to study risk management which will help you manage your capital during a losing streak without sustaining huge losses. 

What to do: 

Take a break from trading and do something else. 

Consider taking just one trade per day until you rebuild your confidence. You may even refrain from trading for a week and go on vacation, giving the markets a chance to shift momentum and your mind space to recalibrate. Once you are fully confident in yourself, your strategy, and your plan, continue with business as usual. 

Take an inventory of your losses and celebrate your wins. 

Take a serious inventory of your trades and assess why you’re on a losing streak. What is preventing you from being profitable? The answer to that question will differ depending on your situation. Perhaps you’re having a hard time spotting good trades, market behavior is unpredictable, or you simply need to spend more time doing your homework. Take your wins and losses, journal down what went right or what you can improve on and close down everything for the day. Watching securities continue to run after your trade could invite a case of FOMO, putting you right back on the wrong side of your losing streak. 

Revisit your trading strategy. 

All strategies work, just not all of the time. Use your trading strategy as a guide to get back on track. Assess what’s working and what’s not working honestly and without judgment. Then, make adjustments where needed. While you may need to make small changes to your trading plan to address gaps, your focus should be on mastering your strategy, not creating a new one. By jumping from market to market and system to system, you could end up prolonging your losing streak. Consistency is the key to making it to the other side profitably. 

Adopt a learners mindset. 

Accept that trading is a lifelong learning process and get back to the basics. Paper trade. Read books. Practice charting. Take a trading class. If you feel jaded about trading, restore your curiosity by soaking up as much information as possible. 

Regulate your emotions and mind your mental health.

Trading is an exercise of logic and emotion. Make sure you’re eating, sleeping, and exercising to keep your mind healthy and operating at its full potential. When you trade while tired, hungry or physically exhausted, you spend valuable mental capital that could assist you in your trading. 

Find a mentor or a support group, but beware of chatroom trading. 

While in the middle of a losing streak, you may feel personally targeted by the market. This is where a community comes in handy. The right community could confirm that the market isn’t attacking your trades since other traders will be echoing the struggles you’re experiencing. A mentor or support group can give you ideas and techniques you may not have been able to discover on your own.


One caveat, beware of chatroom trading. Social media can provide a ton of value or be a pool of bad advice that doesn’t align with your trading style or strategy, creating more confusion. 

Journal about your trading goals. 

You will want to determine the root cause of your losing streak. Maybe the market is just not producing opportunities that fit your strategy. Maybe your execution is off or you are just not executing enough, missing possible winners when they present themselves. Perhaps you’re psychologically self-sabotaging your profitability. 

Journaling can help uncover repetitive habits that are costing you money. 

Never, ever give up. 

Remember this is a marathon, not a race. The goal is to achieve consistent profitability, not to catch every possible winner or hit a home run on every attempt. Keep a positive attitude, maintain situational awareness and stay consistent. 

The bottom line 

Even when you’ve done all of your homework and nailed down your trading strategy, all traders inevitably have losses. The best traders practice how to lose because how you handle losses makes the difference. Even if you go bankrupt, you can brush yourself off and get back up. Be humble, learn from your losses and get back out there!


Get out there and crush it!

For real-time insight follow me on Twitter! @Mv3Trader

Comment below with your opinions and questions.

use-price-action-like-a-pro

Use Price Like A Pro For Better Market Predictions

use-price-action-like-a-pro

If you want to make money trading, it’s critical to understand how markets move, beginning with the fundamentals. While the rules of engagement vary across all market types, whether stocks, crypto, forex, options and others, one key feature serves as a foundation for them all — price action. Not understanding how price works in the markets is like not knowing how to keep score in any sport. Without price, there are no winners or losers.


Mastery of price action is a minimum requirement for any serious trader who wants insight into what triggers people to buy and sell. Price action is a window into human psychology that can help you maximize risk-to-reward ratios, more accurately predict price trends and better time entries and exits.


An entire book could be written about price, but here’s a simple overview to help you get started.

What is price?

Every tradable asset, whether a stock, contract or crypto, is assigned a price. In the stock market, a company receives a valuation and market cap prior to an initial public offering (IPO) that helps determine the cost and quantity of shares released to the market. Similarly, cryptocurrencies begin with zero valuation during an initial coin offering (ICO) and rely heavily on marketing to generate interest and investors.

Once an asset is made available for trading, price is at the mercy of public opinion. As demand increases, price also increases. As demand decreases, price follows.


What is price action?

Credit: Business Insider

Price action is the movement of price over time and the measure of a market’s historical performance. On a chart, price action indicates an asset’s opening price, closing price, highs and lows within a given time frame.


How to read price action:

You may use a combination of technical analysis tools to study price action.

 
Line charts

Line charts are easy on the eyes and simple to read, making them a great place to start for beginner traders. Created by connecting closing prices over time, line charts only illustrate closing prices. Highs, lows and opening prices are not included.

Line chart | Credit: TC2000
 
Bar charts

Bar charts, expand on line charts with vertical bars that illustrate highs and lows, and dashes that show opening and closing prices. A bar will be shaded green if the price closes higher than its opening; and inversely, shaded red if the price closes lower than its opening.

Bar chart | Credit: TC2000
 
Candlestick charts

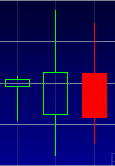
While candlesticks are the most complex charts to read, they also offer the most detailed information about price. Similar to bar charts, candlesticks show opening and closing prices, as well as highs and lows. A hollow candle indicates a higher closing price than opening price; while a filled candle indicates a lower closing price than opening price. Colors of the candles may vary depending on your broker; however, a green, or lighter shade, indicates a price increase in comparison with the previous candle, while a red, or darker shade, signifies a price decrease.

Candlestick chart | Credit: TC2000


Why price matters

Traders study historical price patterns to help make decisions on whether to buy or sell assets. Large spikes in price or sudden shifts in price momentum can signal changes in market interest and valuation of an asset.


To buy or not to buy

Depending on your trading strategy, you may time your entries around price, buying at lows and selling at highs.


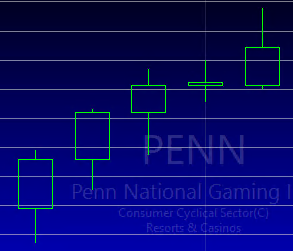
When price opens low and closes high buyers are in control. A series of higher highs and higher lows point to an uptrend, indicating an increase in price.


Uptrend | Credit: TC2000


On the other hand, when price opens high and closes low, sellers are in control. A series of lower lows and lower highs point in the direction of a downtrend.


Downtrend | Credit: TC2000


Understanding price action can help you determine whether to take a bullish or bearish position on a trade, or wait for a trend reversal.


Value and performance

Price is the reflection of a publicly traded company or asset’s valuation on the market. Fluctuations in price over time can tell you a lot about how the public rates a company’s performance. Price often increases on positive news or earnings; although “positive” is subject to market interpretation.


What to look out for


Market sentiment

Within the stock exchange, spend a significant amount of time studying market indexes and the trickle-down effect of price patterns to sectors, industries and stocks.


Also, take note of overall market interest. As an asset becomes overbought (demand exceeds supply) or oversold (supply exceeds demand), price will also fluctuate.


Highs and lows
price-action-highs-and-lows
Display of stock exchange market quotes

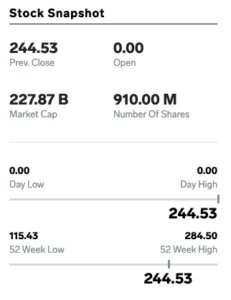
Compare historical highs and lows with current price points to determine the likelihood an asset will move up or down and how much space it has to increase or decrease relative to previous moves. This can help you set price benchmarks and determine risk-to-reward ratios.


Also, as prices near areas of support and resistance (previous lows and highs) the probability of reversal increases.


Trend reversals

What goes up must come down. Look for changes in price action momentum and price patterns to help predict future trends. Take note of how long a price has been increasing or decreasing before taking a trade. The further you are into the trend, the higher the likelihood of a reversal. Sharp spikes are often an indicator of impending crashes.


Within a single uptrending period, there can be dramatic price movements in both bearish and bullish directions. Study price action over various time frames to understand short-term and long-term trends and how they relate. Be sure to trade in the direction of least resistance to maximize your earnings.


Dividends and stock splits


On the stock exchange, companies often issue dividends and stock splits that increase the supply of shares in the market and dilute the value of a stock’s price. Similarly, reverse-splits decrease the supply of shares in the market and compress the value of a stock’s price.


The bottom line

Understanding price is the first step toward being a profitable trader. However, it’s not enough to use price alone to make investment decisions. Use price along with other technical and fundamental indicators to improve your predictions. Use technical analysis tools and study market sentiment to understand trends. Then, take your research to the markets and make money like a pro!


Get out there and crush it!

For real-time insight follow me on Twitter! @Mv3Trader

Comment below with your opinions and questions.