
What is price?
Every tradable asset, whether a stock, contract or crypto, is assigned a price. In the stock market, a company receives a valuation and market cap prior to an initial public offering (IPO) that helps determine the cost and quantity of shares released to the market. Similarly, cryptocurrencies begin with zero valuation during an initial coin offering (ICO) and rely heavily on marketing to generate interest and investors.
Once an asset is made available for trading, price is at the mercy of public opinion. As demand increases, price also increases. As demand decreases, price follows.
What is price action?

Price action is the movement of price over time and the measure of a market’s historical performance. On a chart, price action indicates an asset’s opening price, closing price, highs and lows within a given time frame.
How to read price action:
You may use a combination of technical analysis tools to study price action.
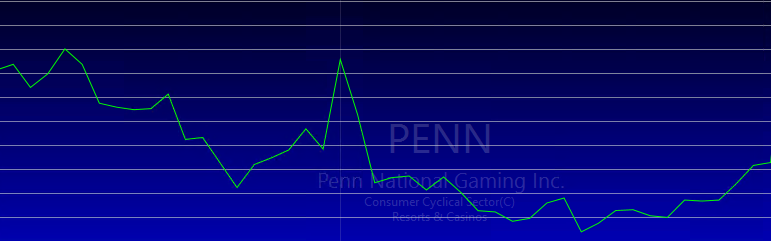
Line charts
Line charts are easy on the eyes and simple to read, making them a great place to start for beginner traders. Created by connecting closing prices over time, line charts only illustrate closing prices. Highs, lows and opening prices are not included.
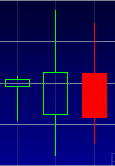
Bar charts
Bar charts, expand on line charts with vertical bars that illustrate highs and lows, and dashes that show opening and closing prices. A bar will be shaded green if the price closes higher than its opening; and inversely, shaded red if the price closes lower than its opening.

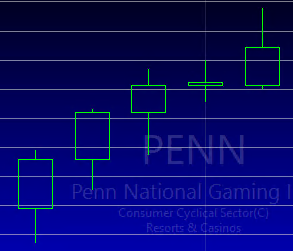
Candlestick charts
While candlesticks are the most complex charts to read, they also offer the most detailed information about price. Similar to bar charts, candlesticks show opening and closing prices, as well as highs and lows. A hollow candle indicates a higher closing price than opening price; while a filled candle indicates a lower closing price than opening price. Colors of the candles may vary depending on your broker; however, a green, or lighter shade, indicates a price increase in comparison with the previous candle, while a red, or darker shade, signifies a price decrease.
Why price matters
Traders study historical price patterns to help make decisions on whether to buy or sell assets. Large spikes in price or sudden shifts in price momentum can signal changes in market interest and valuation of an asset.
To buy or not to buy
Depending on your trading strategy, you may time your entries around price, buying at lows and selling at highs.
When price opens low and closes high buyers are in control. A series of higher highs and higher lows point to an uptrend, indicating an increase in price.
On the other hand, when price opens high and closes low, sellers are in control. A series of lower lows and lower highs point in the direction of a downtrend.

Understanding price action can help you determine whether to take a bullish or bearish position on a trade, or wait for a trend reversal.
Value and performance
Price is the reflection of a publicly traded company or asset’s valuation on the market. Fluctuations in price over time can tell you a lot about how the public rates a company’s performance. Price often increases on positive news or earnings; although “positive” is subject to market interpretation.
What to look out for
Market sentiment
Within the stock exchange, spend a significant amount of time studying market indexes and the trickle-down effect of price patterns to sectors, industries and stocks.
Also, take note of overall market interest. As an asset becomes overbought (demand exceeds supply) or oversold (supply exceeds demand), price will also fluctuate.
Highs and lows

Compare historical highs and lows with current price points to determine the likelihood an asset will move up or down and how much space it has to increase or decrease relative to previous moves. This can help you set price benchmarks and determine risk-to-reward ratios.
Also, as prices near areas of support and resistance (previous lows and highs) the probability of reversal increases.
Trend reversals
What goes up must come down. Look for changes in price action momentum and price patterns to help predict future trends. Take note of how long a price has been increasing or decreasing before taking a trade. The further you are into the trend, the higher the likelihood of a reversal. Sharp spikes are often an indicator of impending crashes.
Within a single uptrending period, there can be dramatic price movements in both bearish and bullish directions. Study price action over various time frames to understand short-term and long-term trends and how they relate. Be sure to trade in the direction of least resistance to maximize your earnings.
Dividends and stock splits
On the stock exchange, companies often issue dividends and stock splits that increase the supply of shares in the market and dilute the value of a stock’s price. Similarly, reverse-splits decrease the supply of shares in the market and compress the value of a stock’s price.
The bottom line
Understanding price is the first step toward being a profitable trader. However, it’s not enough to use price alone to make investment decisions. Use price along with other technical and fundamental indicators to improve your predictions. Use technical analysis tools and study market sentiment to understand trends. Then, take your research to the markets and make money like a pro!