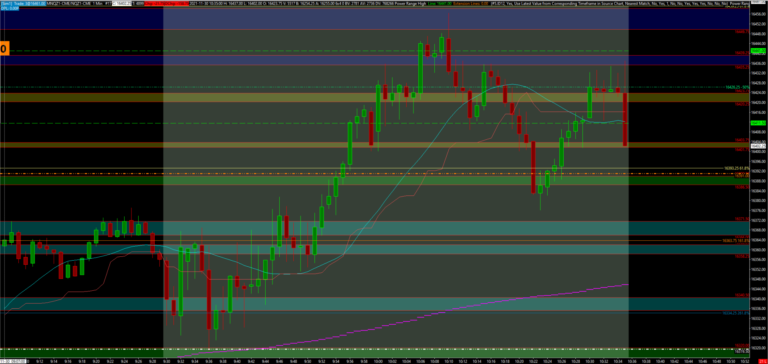
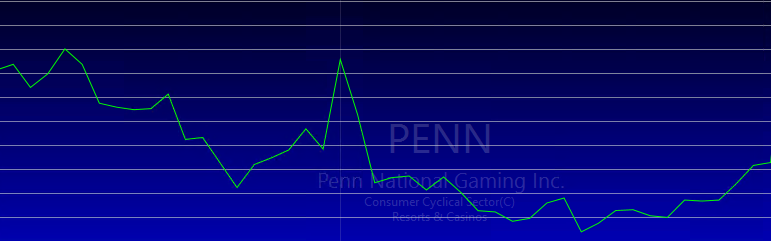
Can you spot our market maker, aka wholesale, in the screenshot above?
What is Wholesale?
Wholesale is at the core of what moves the financial markets every single day. In fact, wholesale is a key driver of all markets. This fact is important to understand because the financial markets (stocks, options, futures, forex, crypto, etc) are the same as any other market. People get together and exchange products of interest for a gain or loss.
Wholesale in the financial market is performed by market makers, facilitating the exchange of financial assets between participating buyers and sellers.
There are two terms we should be familiar with to understand the business decisions and actions of the wholesaler, inventory and supply.
A wholesaler collects inventory at “best price” depending on current market conditions with the goal to later resell that inventory for a profit.
This inventory becomes supply when the wholesaler is ready to sell the products to buyers in the market for a profit.
Learn more with live narration of how I read price action.
Simple Analogy of How Wholesale Conducts Business
To illustrate how this wholesale works in the financial markets we are going to look at through the lens of retail arbitrage.
A retail arbitrageur, or retail arbitrage seller, will look for discounted items in local stores and deals online with the goal of reselling those items for a profit.
On a larger scale, most convenience and grocery stores operate this way, but that’s another topic for another day. Retail arbitrage is typically easier to understand because anyone can do it.
Let’s walk through this illustration from the retail arbitrageur’s (wholesale) perspective. Let’s call our wholesaler for this analogy, Bob.
Bob is looking to buy several shoes, not for his own fashion, but to sell to other people interested in those shoes in his local market.
Bob goes into shoe store 1 and looks for shoes in his price range.
Bob is looking for a specific number of Air Jordans (AJ’s) since he knows his local market has a special interest in those shoes.
Store 1 only has a limited supply of AJ’s so Bob knows he will have to go to another store to find enough AJs to sell to his local market for the profit he wants to walk away with.
In addition to the AJ’s in stock at store 1, Bob also buys some Adidas and Pumas with the purpose of selling those to Store 2 which should also give him more money to fill his inventory of AJ’s. He purchases as many as he can and heads to Store 2.
On the way to store 2 however, Bob met some customers who bought some of his excess inventory. Of course he sold those for more than he paid for them at store 1.
At store 2, they have AJ’s but still not enough to fill his target inventory. Store 2 also was looking to build their inventory of Adidas and Pumas which allowed Bob to sell the rest of his excess inventory.
Bob purchases as many AJ’s as he can get from store 2 plus other brands to repeat the process on his way to store 3. Because of the sold excess inventory, Bob was actually able to purchase the AJ’s to build his inventory even more at a discounted rate.
On to store 3 and AJ repeats the same steps, selling some excess inventory along the way. And once again, thanks to his sells from the excess inventory, Bob was able to fill his target inventory from store 3 at an even bigger discount, also going beyond the inventory of AJ’s Bob was targeting.
Now Bob quickly heads back to his local market with a full inventory, plus excess, marketing all the new shoes in his inventory along the way through his social media outlets. Of course, he sold a few pairs along the way to his target market.
Once he reaches his local market, Bob is met with excited (emotional) shoe enthusiasts ready to buy the AJ’s from him, without knowing, or even caring, that Bob payed much cheaper than they are paying to buy them from Bob.
The more shoes Bob sells from his inventory, the lower his supply gets and as a result the more he charges for the remaining shoes in his supply.
Eventually, Bob satisfies the majority of his local market and shoe sells begins to slow down. So what does Bob do?
Bob starts lowering prices to unload the rest of his inventory in preparation to do market research for what shoes buyers are interested in and heads back to the stores for new inventory.
As a wholesaler, Bob repeats this cycle over and over for massive profits. His local markets loves buying the shoes Bob keeps in his inventory, giving Bob a thriving business.
Market “Research”..
There’s one other key element that we haven’t discussed yet.
How does Bob know which markets are worth his efforts and what to sell in that market?… Customer data.
Wholesale pays for data about participants in the market which they use to make trading decisions. This data is extremely valuable to the wholesaler as it let’s them know which markets and products should give them the best opportunities to make money.
In our example, this would be equivalent to the Bob paying for customer profiles from the shoe stores and online marketplaces.
This information can help Bob develop a strategy around how he purchases and sells shoes for an efficient business.
Why is the recognition of wholesale so important?
Spotting wholesale’s collection of inventory can help us have a slight edge over other participants, unaware of what is behind real-time price action. Alongside wholesale, we can enter our position at “best price” and profit with wholesale as their business is creating momentum in the market where most traders are jumping into trades with more risk.
There are several technical tools and data points that can be used to identify and analyze wholesale trade price action. This article is a highlight of the core concept.
Some of the key things I look at is structure, volume (mostly by price), and VWAP.
Highlighted on the chart below is the price structure wholesale leaves behind.
The Futures market is a great way to trade because it offers leverage. This means that you can buy or sell larger amounts of an asset than you would be able to with stocks, without the need for more money. Futures are also less volatile than stocks and have lower transaction costs. With these benefits and others, trading Futures may sound like a good idea to help diversify your portfolio!
If you want to start trading in the Futures markets, this post will cover everything from what Futures are all about, how they work, what tools you’ll need to get started for free (including charts), as well as some risks involved when trading them! When you’re done reading this post, you will be confident enough to start trading Futures contracts.
I started my Futures trading journey in August of 2017 and never looked back. Trading Futures just simplified everything. Before that I day traded stocks for a couple months the Summer of that same year, basically breaking even. I also traded options for a short period but didn’t really know what I was doing so I lost most of my options plays.
Around this same time, I was reading the book “Mastering the Trade” by John F. Carter, where he was talking about Forex and Futures, mostly Futures. I explored Forex, but Forex never really resonated with me, so I started looking at the Futures market. At the time I was looking at gold Futures primarily and I noticed the strategy I was using to day trade stocks also fit gold Futures. So, I decided to give trading gold Futures a try and the rest is history.
In the following sections, I will briefly explain what the Futures market is and some key things to know about it. I feel like the Futures market is the “hidden” gem of the financial markets. You’ll hear the media reference the Futures market but rarely anywhere else. Most of the hype is with stocks, forex, and cryptocurrency. Personally I have some experience with all those markets, I crushed it with bitcoin back when it surged in 2018, (100% luck) but I still prefer Futures out of everything else.
What this article will cover:
What is the Futures Market
Why Trade Futures
Key things to know about Futures
What you need to trade successfully
What Is The Futures Market?
“A future market is an auction market in which participants buy and sell commodity and futures contracts for delivery on a specified date. Futures are exchange-traded derivatives contracts that lock in future delivery of a commodity or security at a price set today.” – investopedia.com
I recently watched the movie “Rouge Trader” where the main character gave one of the best definitions I have heard. “A futures contract is an agreement to buy or sell a specified amount of a commodity at a future date for a specified price.” That’s all you really need to know. Honestly, you don’t even really need to know that much to be successful at trading Futures. You only need to speculate if the price of the Futures contract will either go up or down within a given period of time before the expiration.
investopedia.com
So, let’s say you want to buy a contract of coffee Futures expiring June 2021. Coffee Futures are currently trading at $100 (hypothetically, using arbitrary numbers for simplicity). If by June coffee is trading at $150 when the contract expires, you will have made a $50 profit per contract and the coffee will be delivered to you as agreed upon in the contract at the $100 price you paid for each contract. Again, I’m just using simple numbers for simplicity’s sake to illustrate the basic concept of how trading Futures work. There’s a bit more to it which we will get into later. Alternatively, if you do not want the physical delivery of coffee, you can sell the contract to another trader interested in trading at market value or a price you specify before the contract’s expiration date in June. These days most Futures traders exit their position before the contract expires to avoid an unwanted physical delivery.
cmegroup.com
Why Trade Futures?
Typically, to trade stocks or options you have to scan for the best stocks to trade every day, or every few days if swing trading. There are some stocks that you can trade pretty much every day, but those stocks are usually priced well above $100 a share and require a significant amount of cash to make decent money. Plus, there’s the PDT rule and interest if you are trading on margin. If you’re not familiar with the PDT rule, it basically doesn’t allow you to day trade stocks if you have less than $25k in your account, with the exception of a cash account. You can technically day trade a stock but there’s a limit to how many open and close orders you can have in a single day per week. If you want to know more about the PDT rule investopedia.com is a great source.
Alternatively, you can trade options on stocks which allows you to get around the PDT rule, but there’s a pretty steep learning curve if you’re just getting into trading. With options it no longer becomes about whether the security increases or decreases in value. You also have to understand how the Greeks and implied volatility affect the premium price of the option. Options are beyond the scope of what we’re talking about here, so I won’t be going into the components that affect the price of an options contract here. Just understand that with options, there’s an added layer of information that must be understood thoroughly beyond the value of the underlying security.
So, getting back to the point, many of the major Futures contracts have plenty of volatility and volume that allows you to trade just one thing every single day. And all you need to be aware of to trade Futures is if you believe the price will either go up or down and if there’s enough volume for liquidity. How much money you can make from a single Futures contract is based on how much you’re willing to risk, taking into consideration how much cash you have to trade with.
Now that you only have to worry about trading one thing, this allows you to focus on what’s really going to help you become a successful trader. Making money as a trader really isn’t about what you trade, it’s more about how you trade.
Narrowing your focus to trading one thing allows you to expedite the development of your skills and psychology that’s required for good trading. You can always go back to other areas of the market later once you have mastered the art of trading.
Now there are even more ways to trade the Futures market. Recently, two new exchange products have been introduced into the Futures market, the Small Exchange and FairX. These new marketplaces within the Futures market aim to offer retail traders more ways to get the most out of their investment capital.
Another beauty of the Futures market is the fact that it’s open 23 hours a day, 5 days a week. The hours for the Futures market are from 6pm to 5pm EST the next day, Sunday through Friday. So, after the weekend the first session of the week starts Sunday at 6pm EST and the week ends Friday at 5pm EST. There’s a one hour break each day. Some less popular commodities have slightly different times, but these are the main hours for the Futures market as a whole.
This means that no matter if you have a full-time job, part-time job, or just busy with something else during normal NYSE trading hours, there’s still opportunity for you to trade in the Futures market. Also, some sectors of the Futures market, such as FX Futures and metals, trade better outside of the NYSE hours with plenty of liquidity. You will have plenty of opportunity to trade in the Futures market at a time that fits your schedule.
Low Startup Capital
Previously I mentioned the amount of money you have to trade with. Here’s another beauty of the Futures market. You don’t need a lot of money to get started. In fact, having more money does not make trading easier. If you can’t trade with $10,000 it’s going to be just as hard for you to trade with $10 million, if not harder. Usually, trading with a small amount of money will get you better results over the long term because it forces you to focus on risk management and discipline.
With Futures, now that we have the micros, you can get started with as little as $50, but in all honesty that will not be enough. At the absolute smallest for a new trader, I would say you would need about $1,000. You’re going to make mistakes and lose money in the process of gaining experience. However, there is another way you can get started for less by trading in a funded account, or a prop firm. Basically, if you can prove to them that you know how to trade, they will give you the capital to trade with in exchange for a portion of your profits. I’m currently trading this way with a company by the name of Leeloo. So, if you want more information about that just check out my YouTube channel and my journal. I am documenting the entire process there.
Consistent Trading Is Universal
Once you learn how to trade the Futures product of your choice with consistency over an extended period of time in various market conditions, you will have all the skills and mentality required to trade anything you want. What I’ve learned by starting with Futures can be applied to stocks, options, forex, CFDs, cryptocurrency, long-term investing and anything else. As a matter of fact, what I’ve learned as a trader has made me a much better buy and hold investor. I can better pick my entries with better precision being familiar with how the price of financial instruments typically move. I would just need to be familiar with the language and nuances of the other markets, but the actual act of trading is universal to all markets.
Key Things to Know About Futures
Margin Requirements
So here is how I derive how much money is required to start. Each derivative of the Futures market has its own margin requirement. Futures margin is not the same as margin on stocks where you’re borrowing money from your broker to increase your buying power. Futures margin is the required amount of cash you must have in your brokerage account when you open a position.
There’s the initial margin requirement which is basically the amount you must have to open the position and decreases your buying power. Then there’s the maintenance margin requirement which is the amount of total funds you must have in your account to trade each Futures contract but does not affect your buying power. With many Futures brokers, if you close the position within the same trading day you only have to worry about the initial margin requirement. When you close the position the initial margin requirement is returned to your buying power plus or minus whatever you gained or lost on the position. You can pretty much look at it as an insurance fee for Futures trading.
These margin requirements are regulated by CME Clearing, but your broker can give you a discount on the margin requirement if you are day trading. Also, these margin requirements can fluctuate depending on market conditions and expected volatility.
That’s the basics of how they work. You can get the full scope by checking out cmegroup.com under the education tab.
So how does all this help you trade with a small account? My primary broker for trading Futures is AMP Futures. As of this writing, their initial margin requirement for micro e-mini Futures is as low as about $40. That $40 margin requirement is for the most popular micro E-mini S&P 500 Futures.
I trade the micro E-mini Nasdaq Futures which has an initial margin requirement of $100. So, if you decide to trade the micro S&P Futures with an initial margin requirement of $40 in a trading account with $1,000, that gives you pretty good wiggle room to trade about 1 to 3 contracts at a time depending on your strategy. Of course you will need a solid risk management plan. Some brokers will monitor your orders to make sure you are trading with a stop loss, showing that you are attempting to manage your risk.
ampfutures.com
Contract Months and Expiration Date
Earlier, I briefly mentioned contract expiration. One thing that is important to keep track of is the expiration date of the Futures contract you are trading.
Futures are basically categorized by sector, such as the indices, metals, agriculture, and energy. The expiration date is usually set by the sector. For example, all index Futures usually expire on the same date. The metals have their own contract months and expiration dates collectively. Energy Futures have their contract months and expiration dates… and so on.
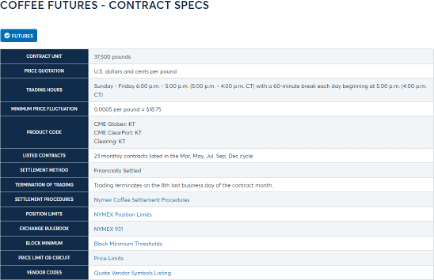
If you are day trading Futures you only need to keep track of the expiration date in regard to where the volume is. You want to trade the contract month where most of the volume is to make sure you have plenty of liquidity to get in and out of your positions. If you are swing trading Futures, it’s really important to keep track of the expiration date to make sure you don’t get an unwanted delivery of the commodity you’re trading. So going back to the coffee example, if you are holding contracts of coffee Futures when they expire, you could end up with 37,500 pounds of coffee per contract. I like coffee but not that much. I don’t have personal experience with this, but most brokers today will notify you beforehand that the contracts you are holding are about to expire and close them for you if you don’t roll them over to another contract month or close the position yourself.
There’s one more key thing you need to be aware of with Futures: ticks and points.
Ticks and Points
Basically, these terms are synonymous with pennies and dollars in the sense of how the price of each contract increments. These terms actually apply to stocks as well even though you don’t hear many people using them anymore. As an example, when QQQ (ETF for Nasdaq) changes from 100 to 100.01 that would be a change of 1 tick. QQQ changing from 100 to 101 would be a change of 1 point. It’s basically the same thing with Futures, with the exception that the increment of a Futures contract is not the same and varies based on the Futures contract.
For example, a 1 tick increment of Nasdaq Futures (NQ) is 0.25. A point increment is pretty much the same as the dollar amount of a stock, incrementing by the whole number. However, since a tick for NQ is 0.25, there are 4 ticks in 1 point for NQ, instead of the 100 ticks per point for a stock. Hope you’re still with me. It’s much more simple than it seems written out.
Just as an FYI, for Dow Futures the tick and point are the same. The DOW Futures only increment by the whole number, which is why I believe the media likes to use the DOW Futures whenever they are talking about big swings in “the market”. 500 points is more likely to trigger your emotions than 25 points. (Just a little conspiracy theory side note LOL)
Tick Value
Which takes us to the value of each tick and point. So, where you have a tick of a stock equaling a penny and a point a dollar, a tick for the Nasdaq futures has a value of $5 and a point value of $20 (4 ticks times $5 = $20). So, in terms of your profit and loss (PnL), for every contract you trade on NQ, you earn $5 for every tick that goes in your favor from your entry price. And of course, if the trade goes against you, you lose $5 for every tick that goes against your entry price.
Since we’re talking about the money of your trade, just a quick note on the psychology of trading. You haven’t lost any money until the position is closed. So be patient with your trades. You’re lucky if a trade immediately takes off in your favor after your entry order has been filled.
Alright, so back to ticks and points. To give another example, a gold Futures tick increment is 0.10, giving you 10 ticks in a point. The tick value for gold futures is $10 dollars or $100 dollars for a point.
All you really need to remember is the tick value and how it increments. Basic math can give you the point value.
What You Need to Trade Successfully
Psychology
Your thoughts control everything. What you focus on will become the reality. The reason why I make that point is once you start taking losses, if you spend too much energy focusing on those losses, guess what will follow?.. More losses!
Those losses turn into a losing streak. Most of the time the way out of this losing streak is just to take a break from trading for a while. However long it takes to clear that energy developed once you start to become emotional about taking a loss. If you’re not getting emotionally tied to your losses, and you’re being honest with yourself, you shouldn’t have much of a problem staying consistent to your strategy and getting back into the green.
You must be comfortable with seeing negative numbers in your account. Not all of your trades will work out and you have to be comfortable with that. Not to the point where you’re completely unfazed by a loss, but enough to where you know that your consistency will outweigh the losing side of your trades.
Experience
Much of the fear with trading comes from the unknown. This is what makes experience so important. The more you experience the various market conditions, the ebb and flow of the market, the more confident you are likely to be when you start to notice the trends that repeat themselves. Technical analysis allows you to visually see the trends of the market per the security or derivative you are trading. The experience you gain as you watch and interact in the market from day to day, with your perspective, will help you develop a plan around the trends you recognize most often.
Strategy
Having a strategy helps you develop your skill and execute with consistency. When you are starting, you want to find a strategy that you understand and resonates with your personality. If you are not a patient person, it may not be the best idea to trade with a strategy that requires a lot of patience. Your weaknesses can be improved later.
Your strategy and plan should take into consideration what triggers you to take a trade, how you place your entry order, how you plan on exiting the entry order, and how you will manage the risk of trades that do not work out.
Also, I recommend that your strategy is as simple as you can possibly make it. There’s honestly no need to have dozens of indicators on your chart. Once you develop the skill of reading price structure, price action (the energy of the market), trends and market conditions you will realize indicators are mostly a way of making it easier to see the story that the price is already telling you.
I am not going to go too deep into each of these for this article, but all of these work together towards your journey of trading. Your strategy simplifies trading that allows you to get the experience and work on any psychological blockage you may have. Experience helps you refine your strategy and builds your confidence which positively affects your psychology. Your psychology affects how well you execute your strategy and helps you fill in the holes to see the bigger picture of the market when smaller time frames become irrationally volatile.
Everything I explained here about Futures is only the tip of the iceberg. There’s more to it but it’s honestly not complicated at all. I had to remind myself of some of these terms because it’s not necessary to remember all of this in order to trade Futures well.
All this may seem like a lot to take in when you’re first introduced to the Futures market but it doesn’t take long before it becomes 2nd nature.
Now that you know the basics of trading the Futures market, get in the game. You got this!
If you want to make money trading, it’s critical to understand how markets move, beginning with the fundamentals. While the rules of engagement vary across all market types, whether stocks, crypto, forex, options and others, one key feature serves as a foundation for them all — price action. Not understanding how price works in the markets is like not knowing how to keep score in any sport. Without price, there are no winners or losers.
Mastery of price action is a minimum requirement for any serious trader who wants insight into what triggers people to buy and sell. Price action is a window into human psychology that can help you maximize risk-to-reward ratios, more accurately predict price trends and better time entries and exits.
An entire book could be written about price, but here’s a simple overview to help you get started.
Every tradable asset, whether a stock, contract or crypto, is assigned a price. In the stock market, a company receives a valuation and market cap prior to an initial public offering (IPO) that helps determine the cost and quantity of shares released to the market. Similarly, cryptocurrencies begin with zero valuation during an initial coin offering (ICO) and rely heavily on marketing to generate interest and investors.
Once an asset is made available for trading, price is at the mercy of public opinion. As demand increases, price also increases. As demand decreases, price follows.
Price action is the movement of price over time and the measure of a market’s historical performance. On a chart, price action indicates an asset’s opening price, closing price, highs and lows within a given time frame.
You may use a combination of technical analysis tools to study price action.
Line charts
Line charts are easy on the eyes and simple to read, making them a great place to start for beginner traders. Created by connecting closing prices over time, line charts only illustrate closing prices. Highs, lows and opening prices are not included.
Line chart | Credit: TC2000
Bar charts
Bar charts, expand on line charts with vertical bars that illustrate highs and lows, and dashes that show opening and closing prices. A bar will be shaded green if the price closes higher than its opening; and inversely, shaded red if the price closes lower than its opening.
Bar chart | Credit: TC2000
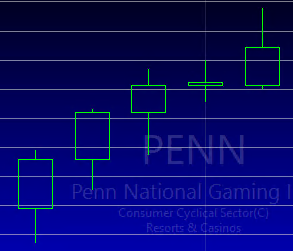
Candlestick charts
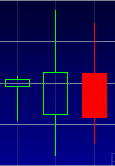
While candlesticks are the most complex charts to read, they also offer the most detailed information about price. Similar to bar charts, candlesticks show opening and closing prices, as well as highs and lows. A hollow candle indicates a higher closing price than opening price; while a filled candle indicates a lower closing price than opening price. Colors of the candles may vary depending on your broker; however, a green, or lighter shade, indicates a price increase in comparison with the previous candle, while a red, or darker shade, signifies a price decrease.
Candlestick chart | Credit: TC2000
Why price matters
Traders study historical price patterns to help make decisions on whether to buy or sell assets. Large spikes in price or sudden shifts in price momentum can signal changes in market interest and valuation of an asset.
To buy or not to buy
Depending on your trading strategy, you may time your entries around price, buying at lows and selling at highs.
When price opens low and closes high buyers are in control. A series of higher highs and higher lows point to an uptrend, indicating an increase in price.
Uptrend | Credit: TC2000
On the other hand, when price opens high and closes low, sellers are in control. A series of lower lows and lower highs point in the direction of a downtrend.
Downtrend | Credit: TC2000
Understanding price action can help you determine whether to take a bullish or bearish position on a trade, or wait for a trend reversal.
Value and performance
Price is the reflection of a publicly traded company or asset’s valuation on the market. Fluctuations in price over time can tell you a lot about how the public rates a company’s performance. Price often increases on positive news or earnings; although “positive” is subject to market interpretation.
What to look out for
Market sentiment
Within the stock exchange, spend a significant amount of time studying market indexes and the trickle-down effect of price patterns to sectors, industries and stocks.
Also, take note of overall market interest. As an asset becomes overbought (demand exceeds supply) or oversold (supply exceeds demand), price will also fluctuate.
Highs and lows
Display of stock exchange market quotes
Compare historical highs and lows with current price points to determine the likelihood an asset will move up or down and how much space it has to increase or decrease relative to previous moves. This can help you set price benchmarks and determine risk-to-reward ratios.
Also, as prices near areas of support and resistance (previous lows and highs) the probability of reversal increases.
Trend reversals
What goes up must come down. Look for changes in price action momentum and price patterns to help predict future trends. Take note of how long a price has been increasing or decreasing before taking a trade. The further you are into the trend, the higher the likelihood of a reversal. Sharp spikes are often an indicator of impending crashes.
Within a single uptrending period, there can be dramatic price movements in both bearish and bullish directions. Study price action over various time frames to understand short-term and long-term trends and how they relate. Be sure to trade in the direction of least resistance to maximize your earnings.
Dividends and stock splits
On the stock exchange, companies often issue dividends and stock splits that increase the supply of shares in the market and dilute the value of a stock’s price. Similarly, reverse-splits decrease the supply of shares in the market and compress the value of a stock’s price.
The bottom line
Understanding price is the first step toward being a profitable trader. However, it’s not enough to use price alone to make investment decisions. Use price along with other technical and fundamental indicators to improve your predictions. Use technical analysis tools and study market sentiment to understand trends. Then, take your research to the markets and make money like a pro!